We prove what
happened.
Crush depth. Tire yaw marks. Rest positions. We measure the wreckage down to the tenth of a second — and put it before a jury.
The evidence
doesn't lie.
Four interlocking disciplines. Each one independently verifiable. Together, they reconstruct the physics of any collision with courtroom-grade precision.
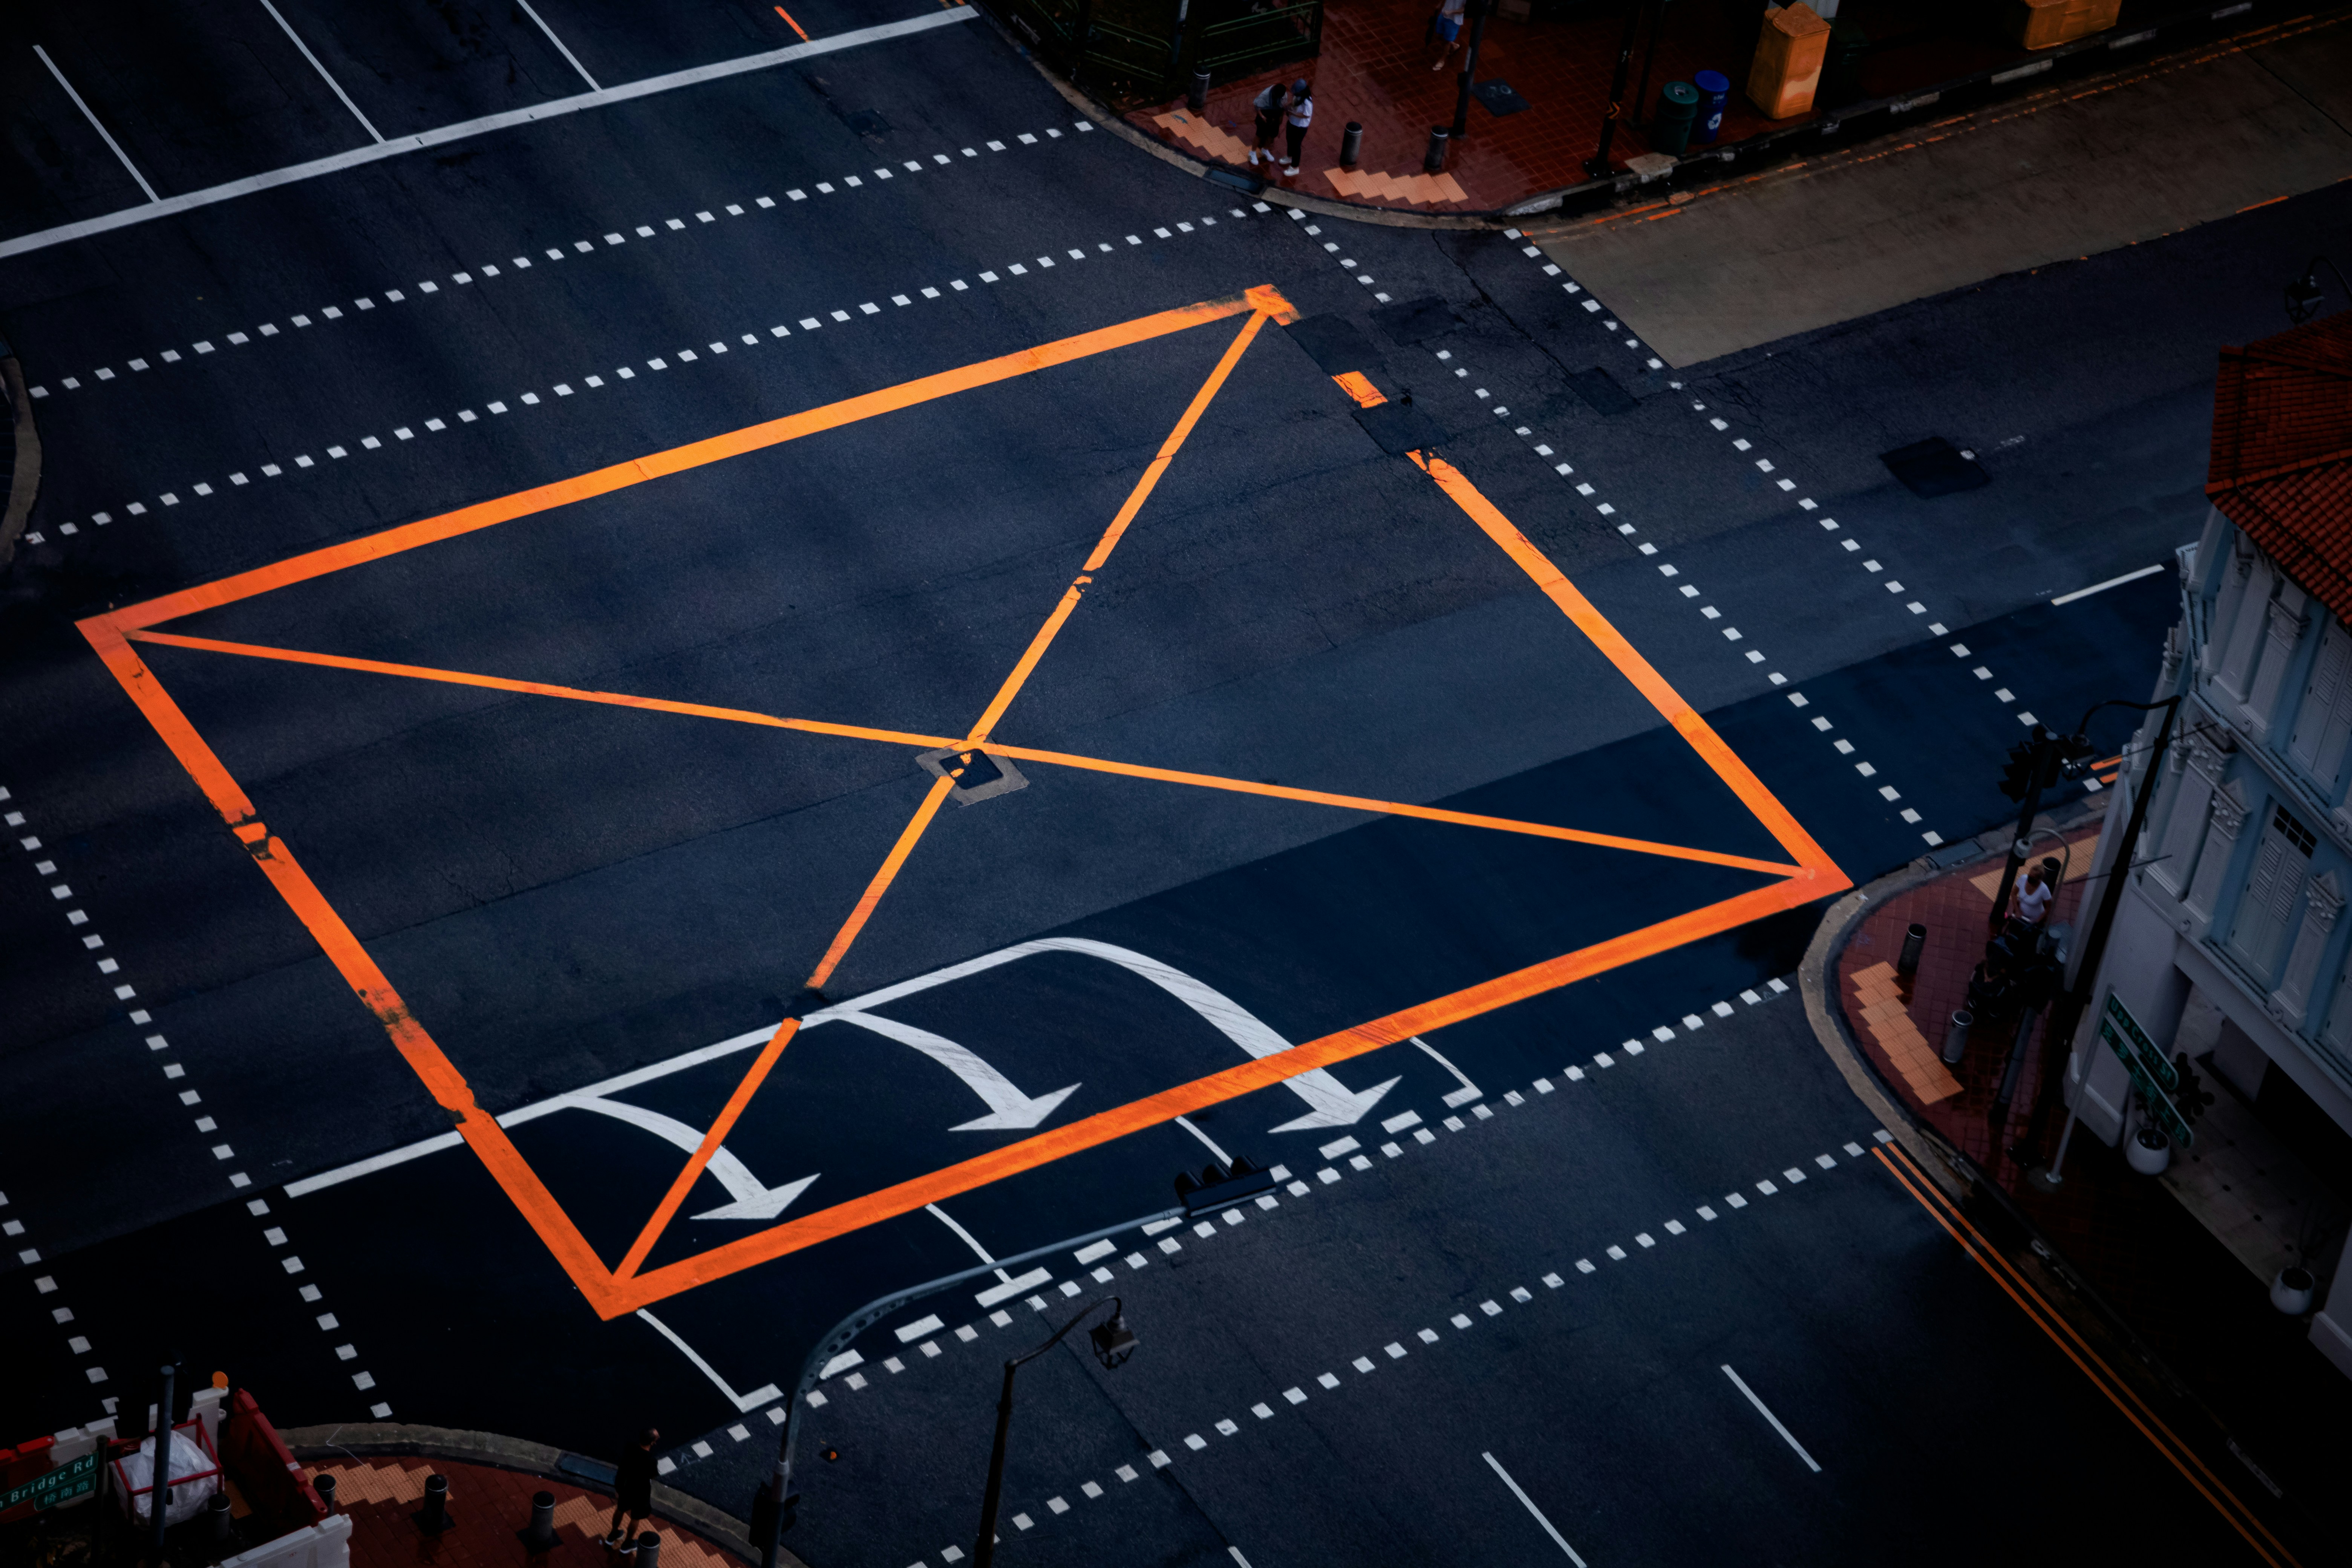
Scene Documentation
Sub-centimeter accuracy. We deploy structured-light scanning and drone photogrammetry to capture every skid mark, gouge, and debris field before a single piece of evidence moves.
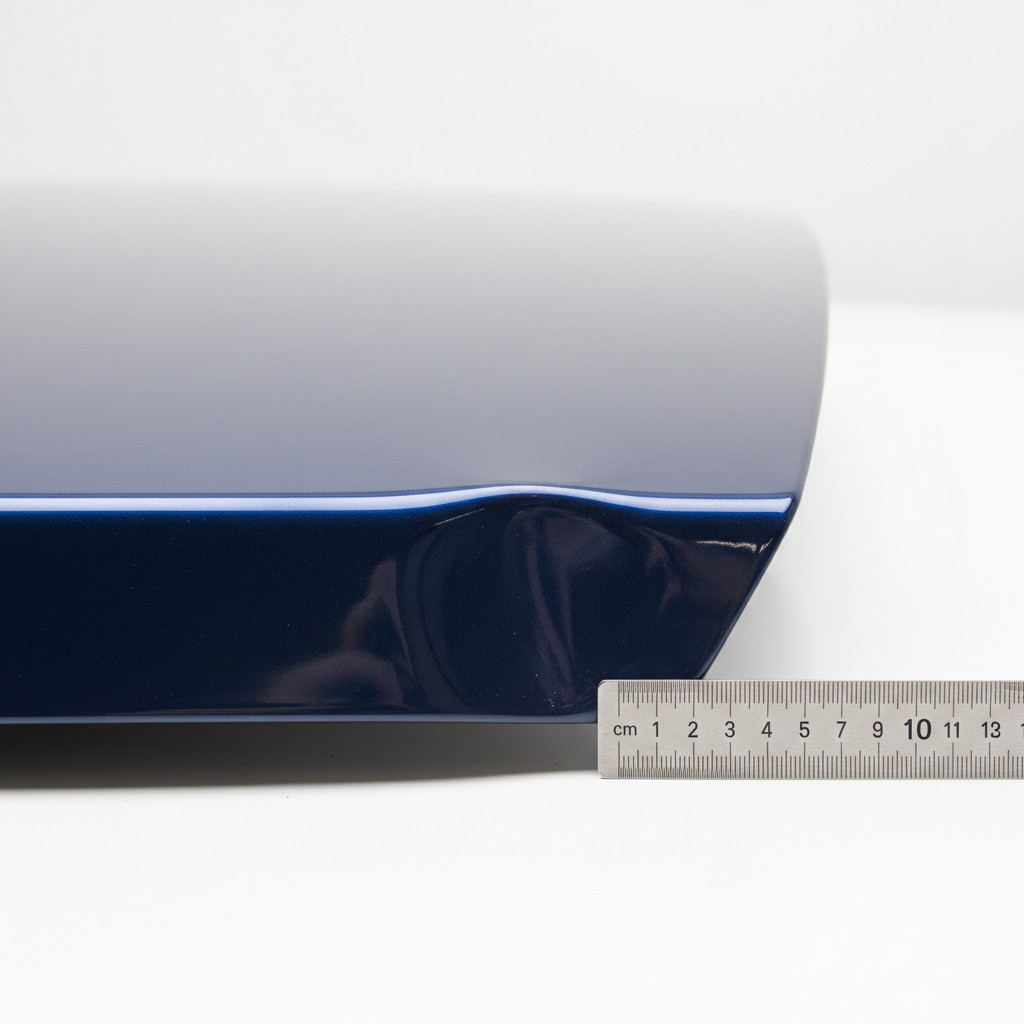
Physical Evidence
Structural deformation translates directly to delta-V. We measure crush depth at 10-cm intervals across every principal direction of force.
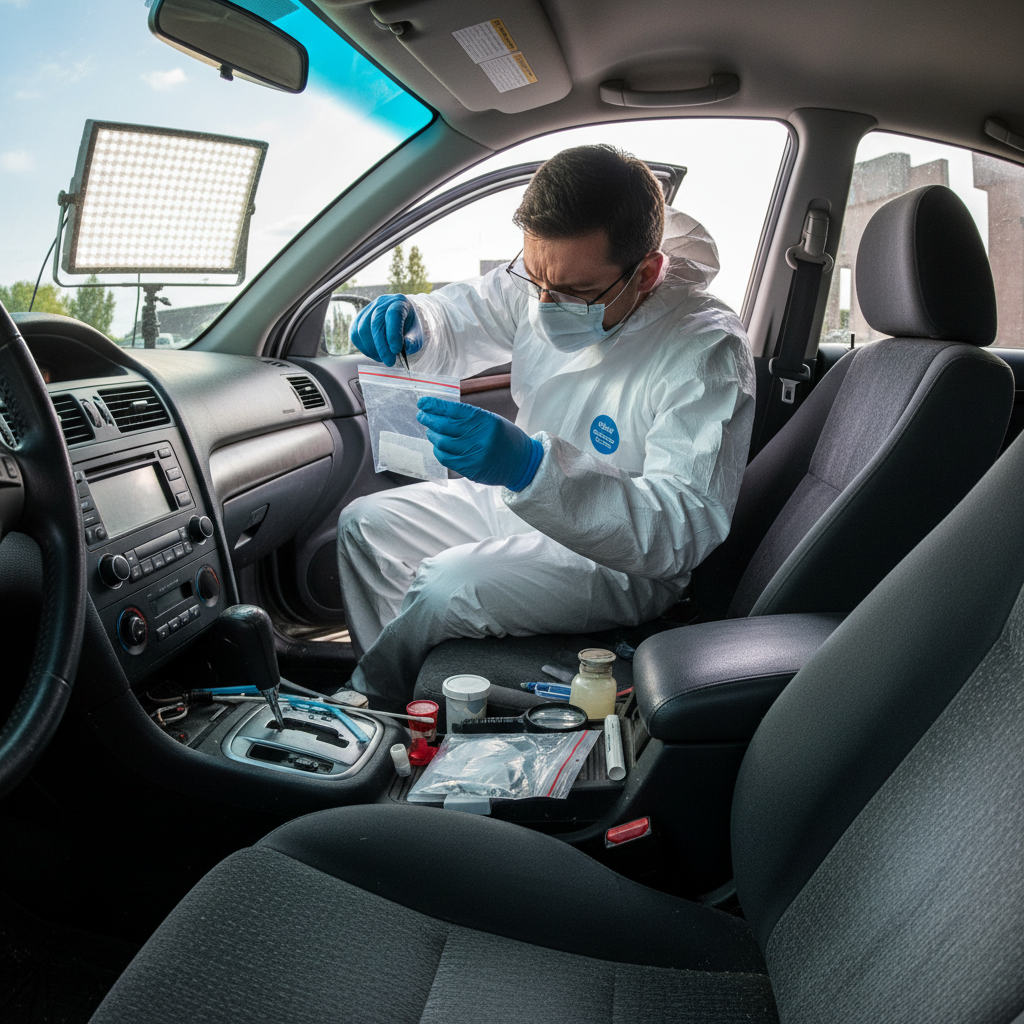
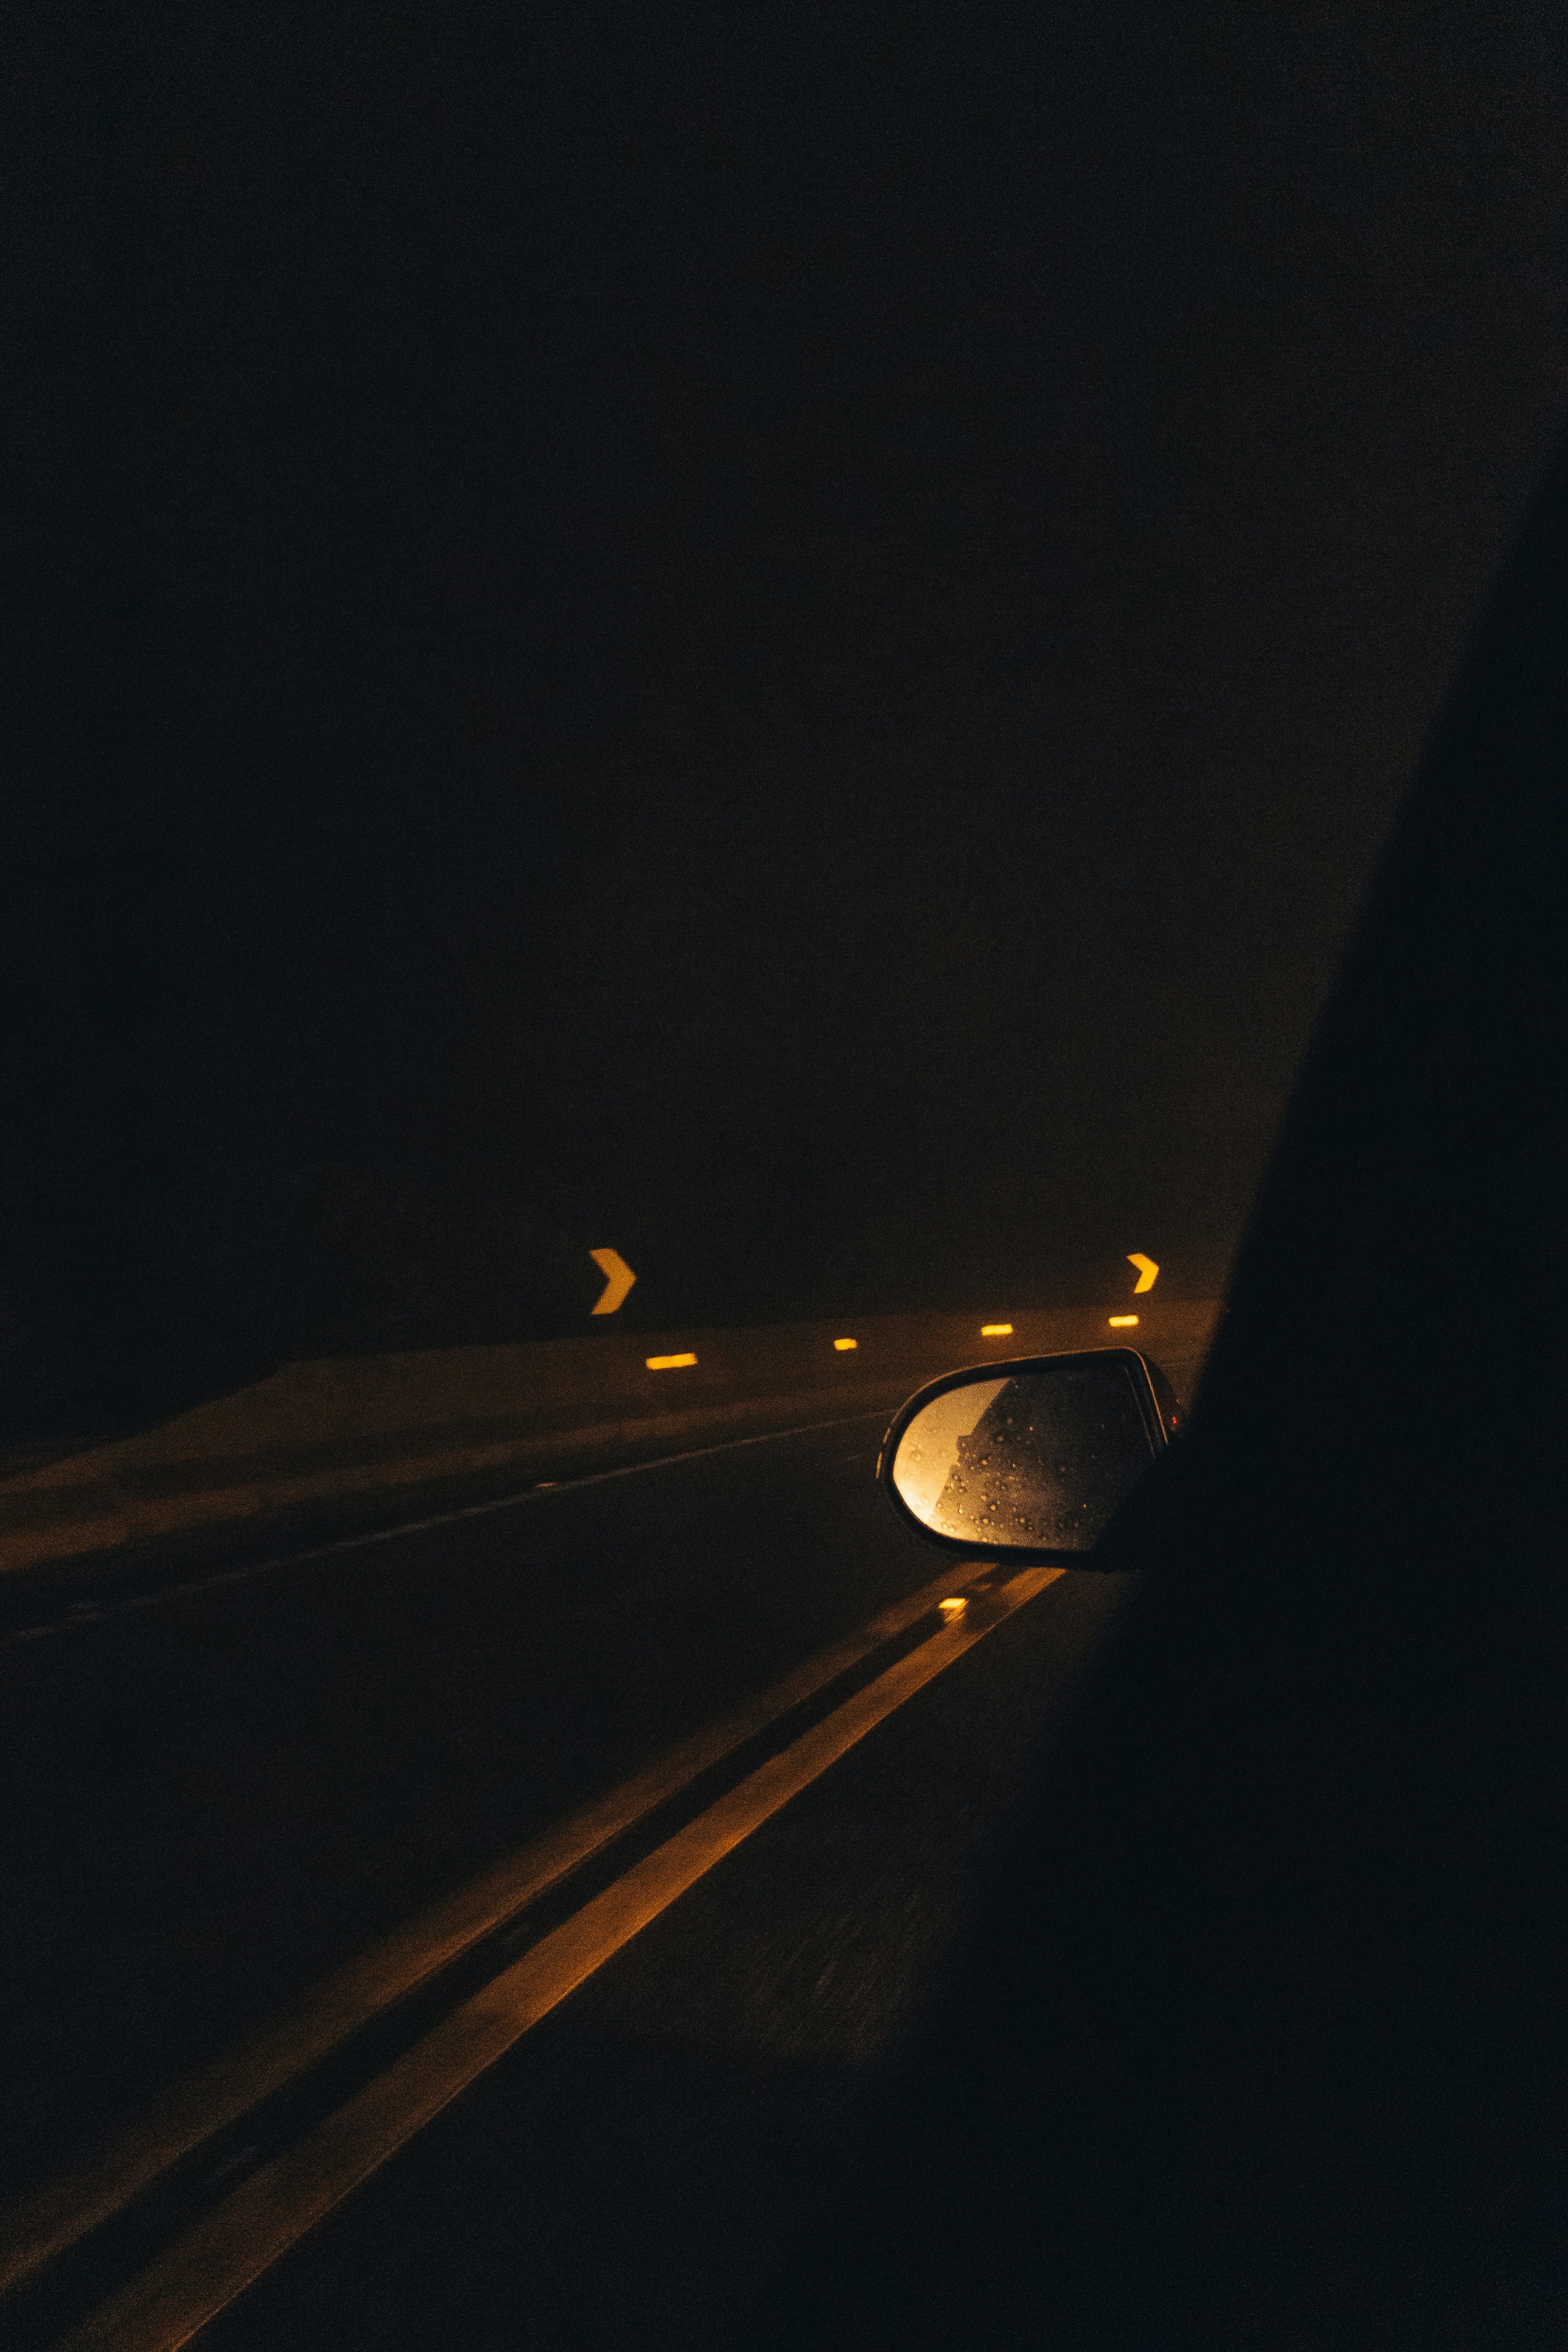
Digital Evidence
Event Data Recorders capture speed, throttle, braking, and seatbelt status 5 seconds before impact. We extract and authenticate every byte.
Witness Correlation
We model what each driver could see, when they could see it, and whether their stated reaction time is physically consistent with the evidence.
Numbers that
survive cross-examination.
Every figure is derived from peer-reviewed methodology, measured physical evidence, and independently validated calculations. Not estimates. Not approximations. Proof.
Derived from crush depth, EDR data, and pre-impact yaw mark radius. Cross-validated against three independent methods.
Change in velocity during principal direction of force. Directly correlates to occupant injury probability.
From hazard perception point to first contact. Determines whether evasive action was geometrically possible.
Maximum principal direction crush at driver door. Measured at 10-cm horizontal intervals per NHTSA protocol.
Every collision
has a geometry.
Vehicle — Vehicle
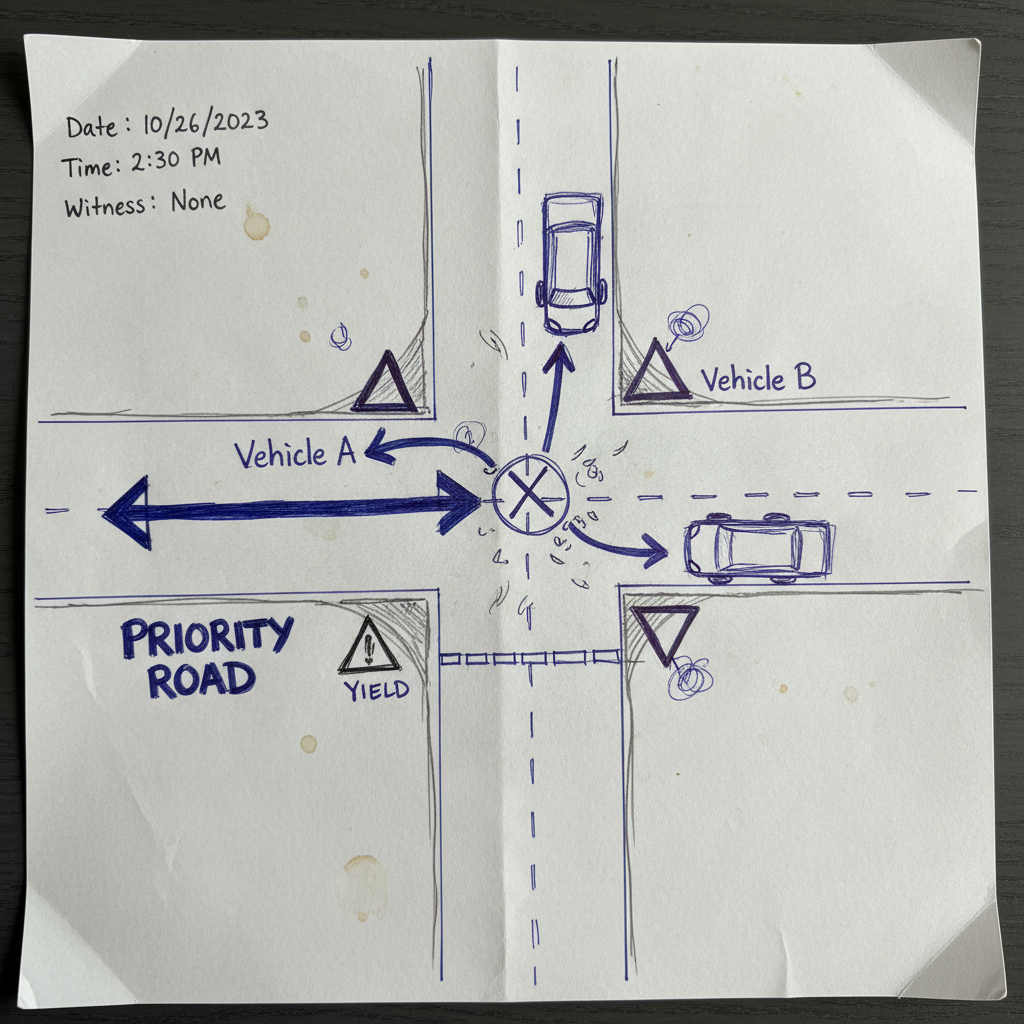
Multi-vehicle collisions at intersections, highway rear-ends, and lane-change disputes. We establish fault through approach speed, gap acceptance, and signal timing — not witness memory.

Vehicle — Pedestrian
Sight line analysis, pedestrian gait speed, and driver perception-reaction windows determine whether impact was avoidable.
Commercial Fleet
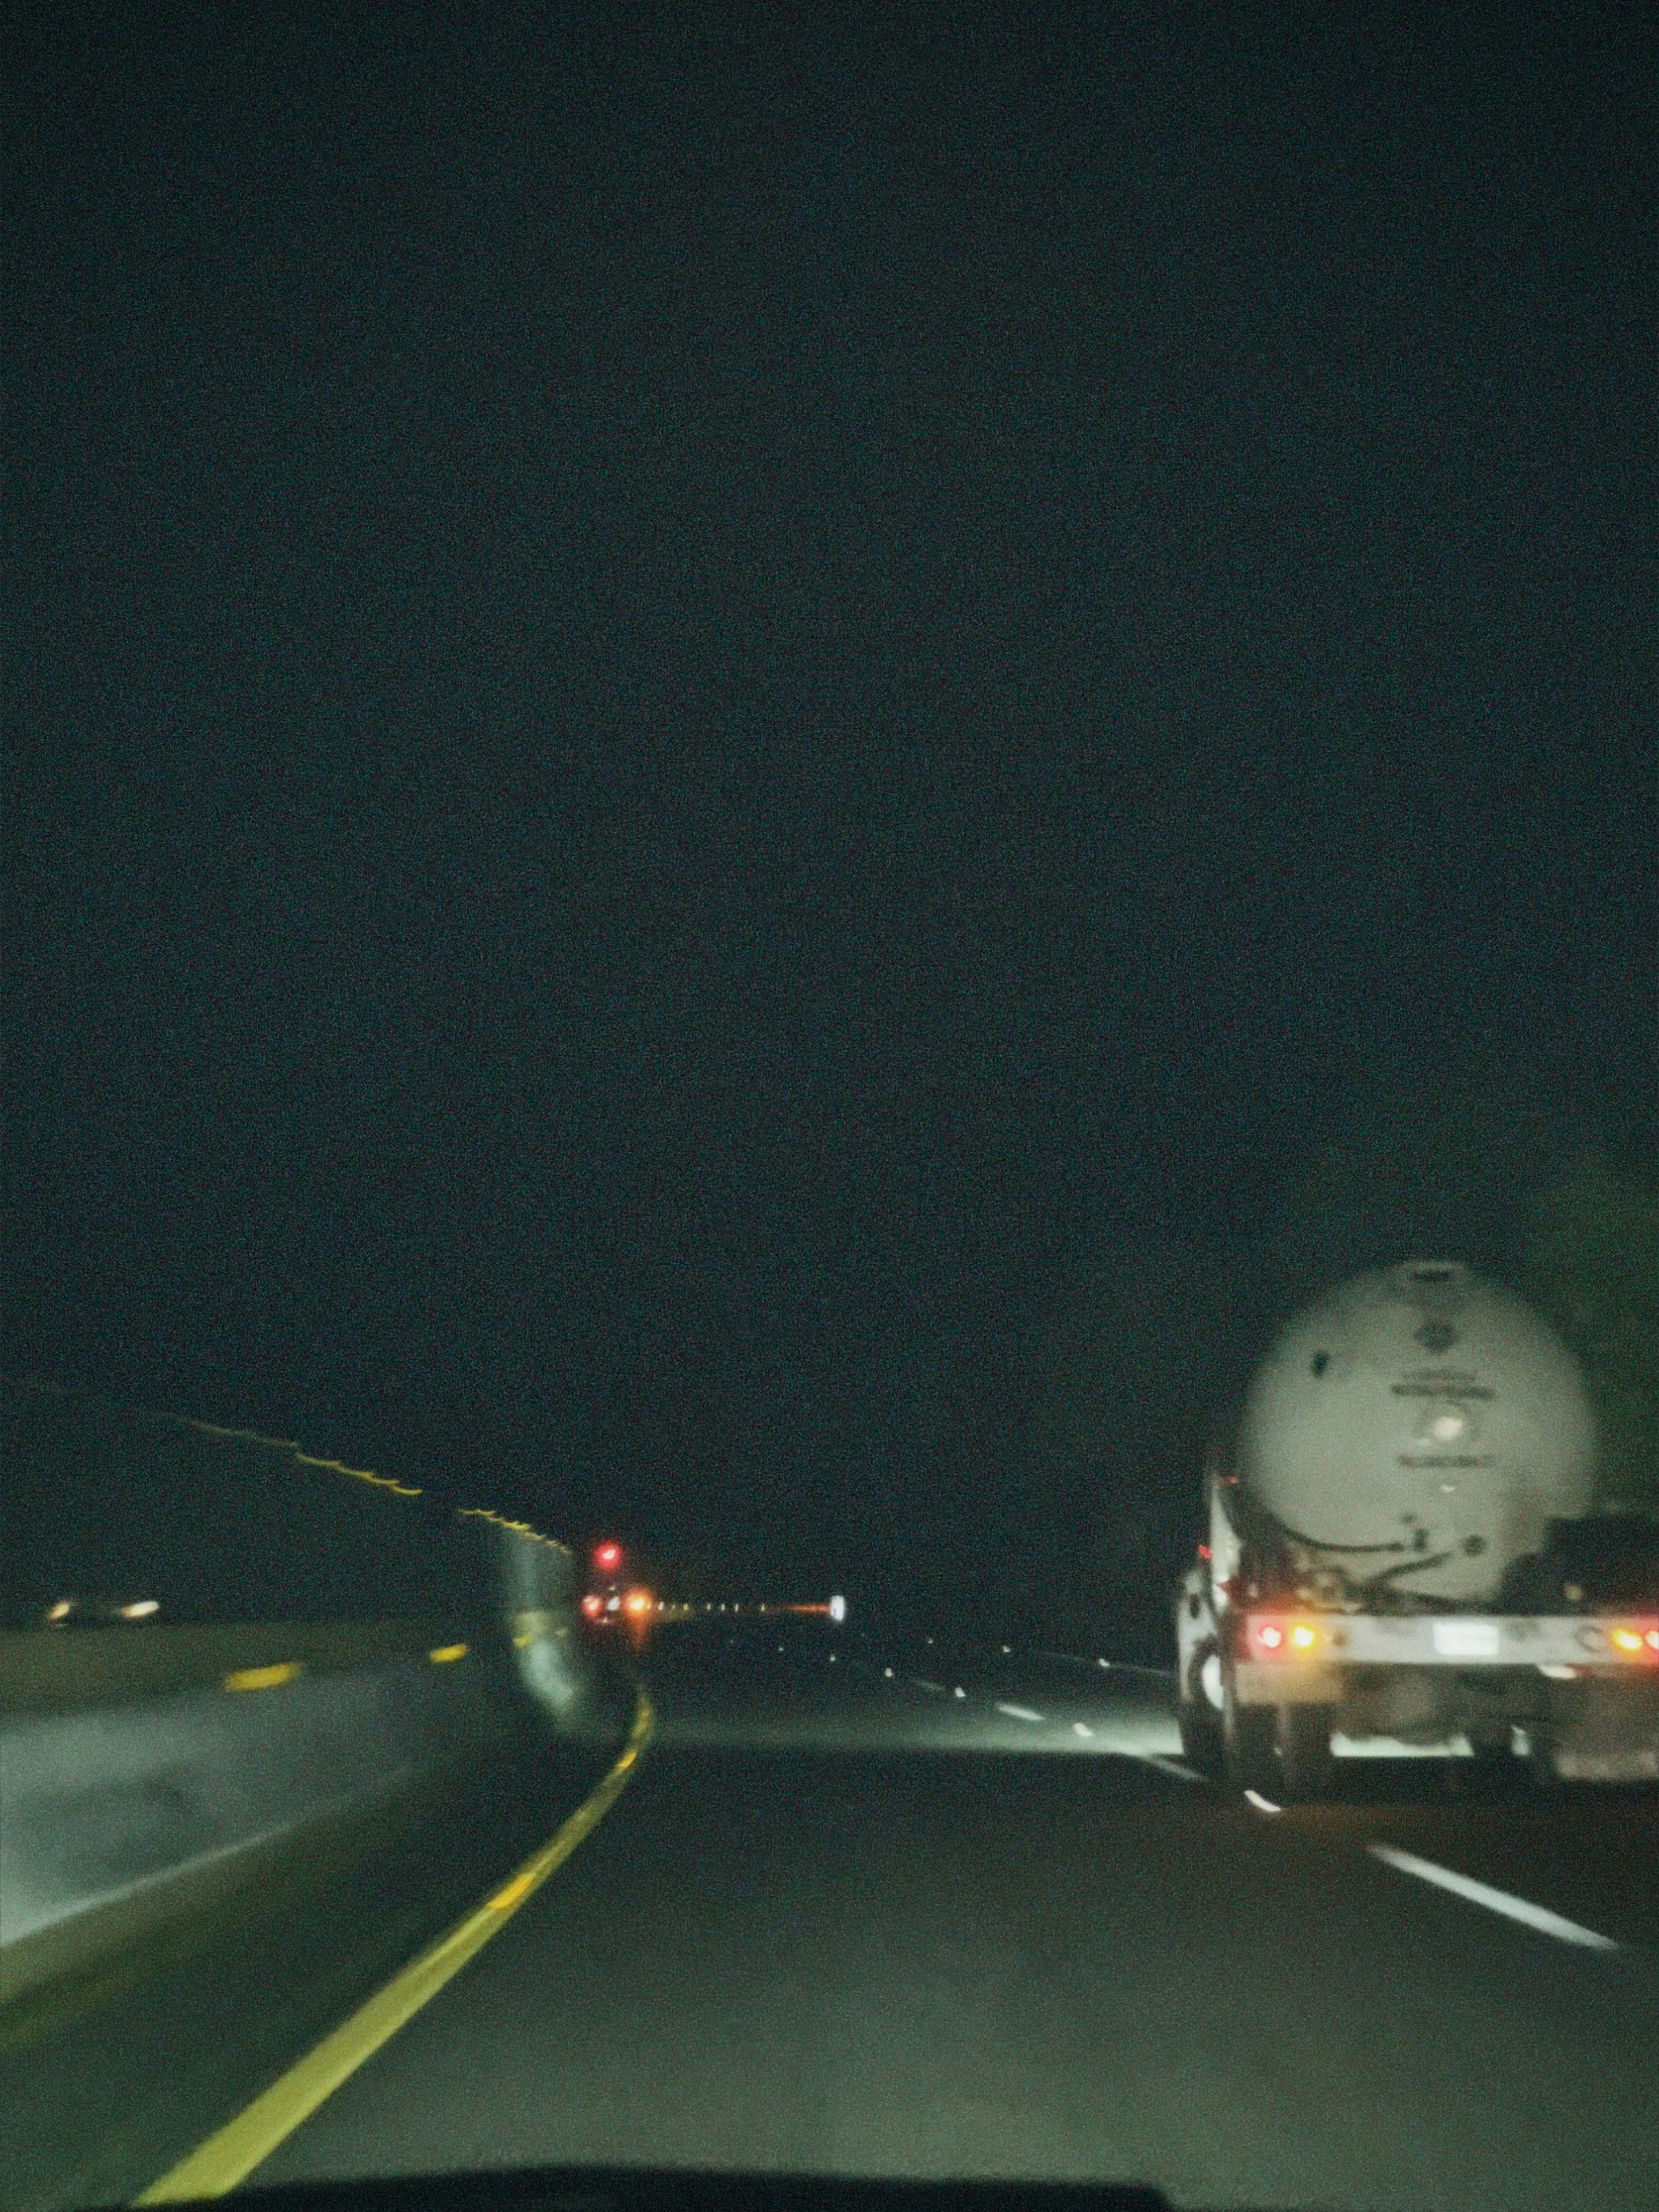
Log book analysis, ELD data, and hours-of-service reconstruction for fatal workplace vehicle incidents. Built for OSHA investigations and wrongful death litigation.
Motorcycle
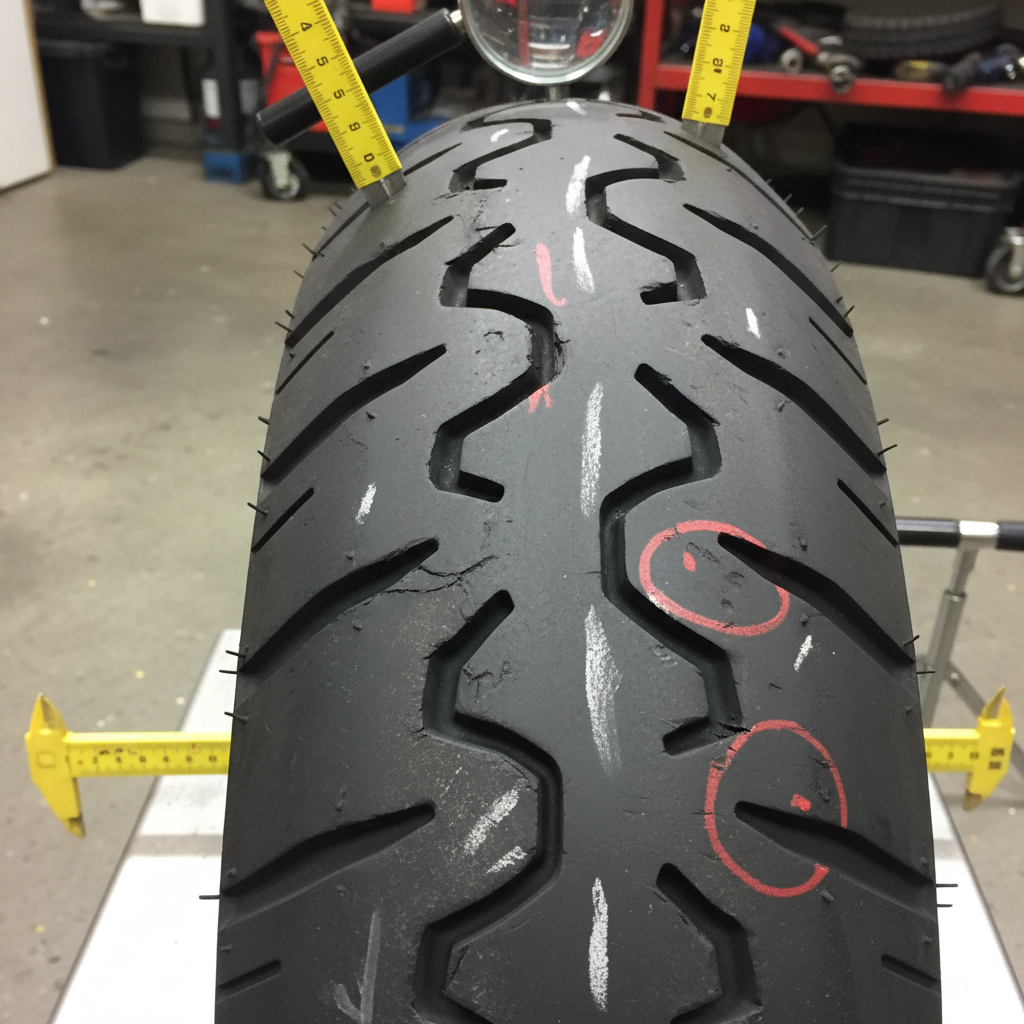
Tire marks, lean angle calculations, and pre-crash speed from yaw radius. We counter the bias that motorcycle riders are automatically at fault.
Not sure which category fits your case? Submit the facts and we'll classify it.
Confidential Case ReviewWhat you receive
in evidence.
Expert Witness Report
Daubert-compliant written report documenting methodology, evidence, calculations, and opinions. Structured for deposition and trial.
3D Animation
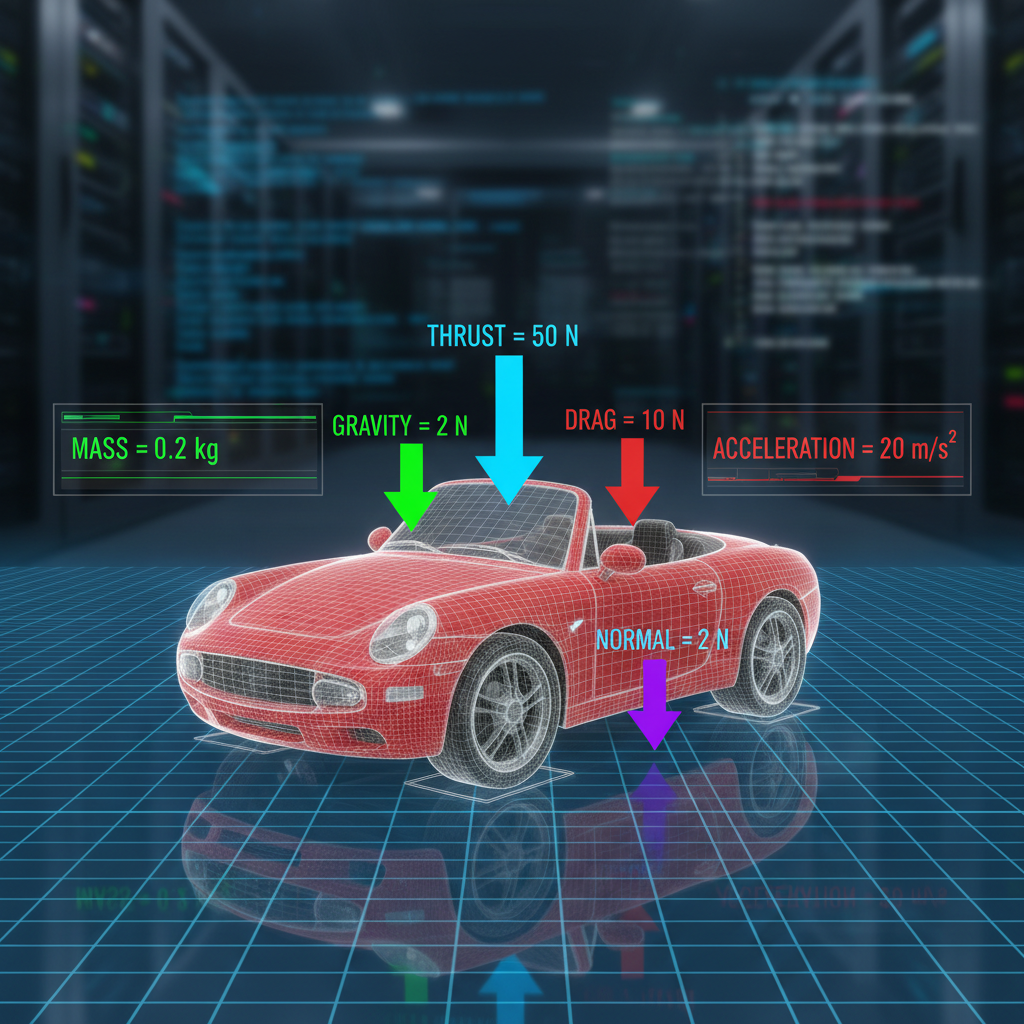
Photorealistic, physics-accurate collision animation for courtroom presentation. Rendered from reconstructed scene data — not artistic interpretation.
Timeline Reconstruction
Frame-by-frame timeline from first hazard visibility to final rest position. Each event timestamped to 0.1-second resolution.
Scene Diagram Package
CAD-accurate scale diagrams showing pre-impact positions, paths of travel, and post-impact rest positions. Formatted for court exhibit.
Ready to build your case?
Submit your case for a confidential review. We'll assess the evidence, confirm jurisdiction, and provide a scope within 48 hours.
Submit Your Case for ReviewDownload a redacted expert report to evaluate our methodology and courtroom format before committing.